How We Transformed a Failed Business into a £2.2B Exit with This 3-Stage Data Framework
The data maturity roadmap that turned a £5M acquisition into a billion-pound delisting—and the sequence most businesses get wrong
"We're buying uSwitch."
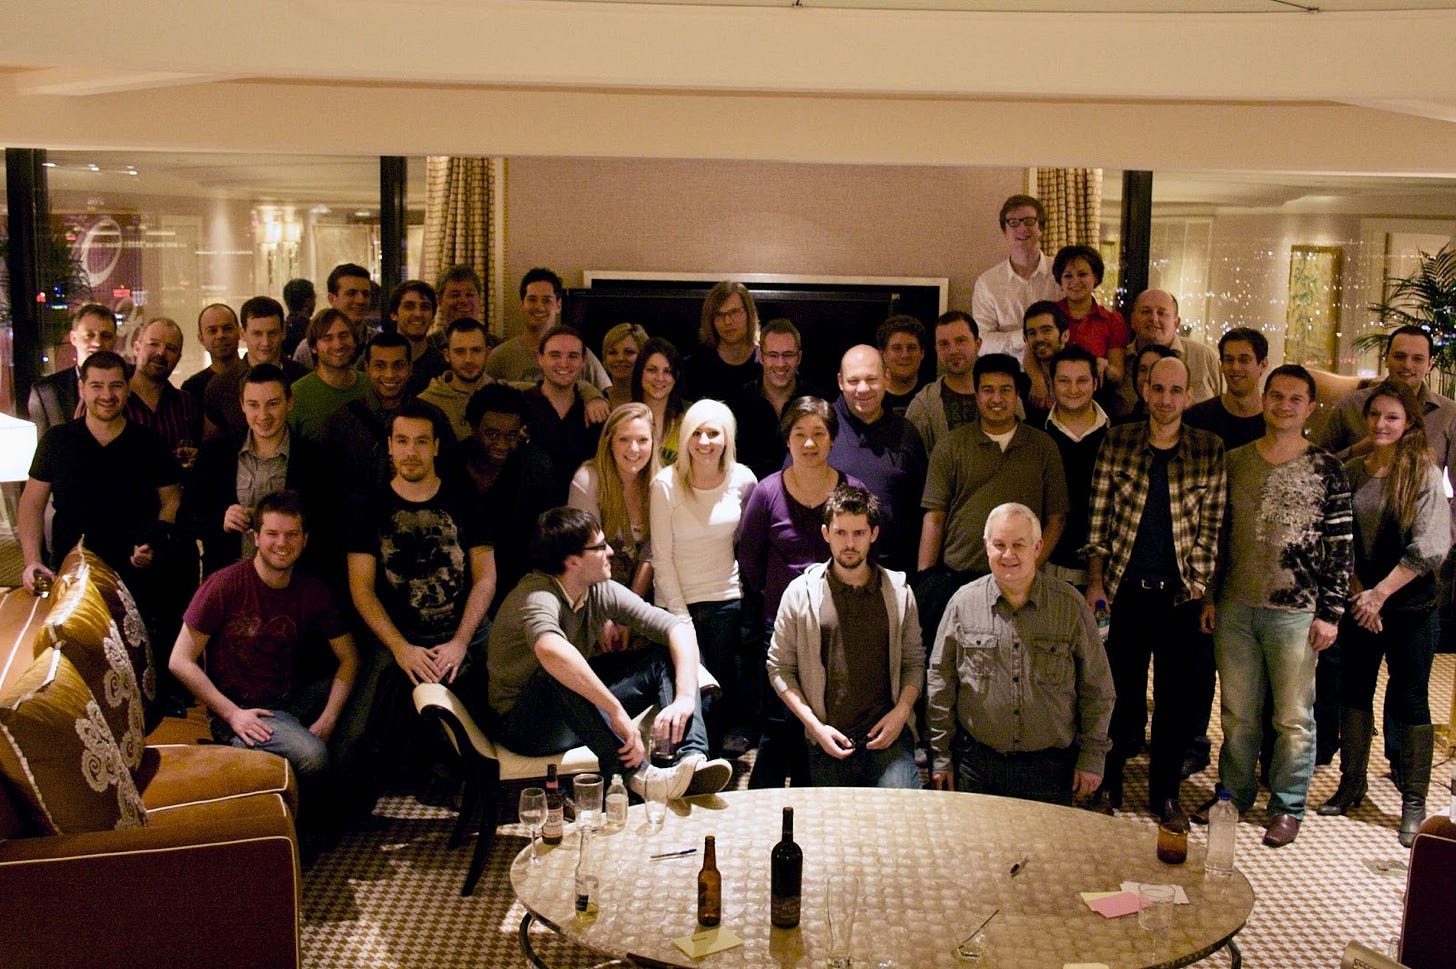
After an exceptional year, Neil, the founder of TrafficBroker, had taken the whole company to Las Vegas for our Christmas party. He then casually dropped this bombshell on us all in a meeting in our hotel suite at the Wynn. The comparison site founded by the Queen's cousin had once sold for £210 million but was now being acquired for just £5 million.
This 97% collapse in value created a unique opportunity for us—but was it a catastrophic mistake or a calculated gamble?
Thinking nothing of it that night, I learned to play blackjack (and how to chip flip, much to the croupier's annoyance). I quickly discovered blackjack rewards those who understand probability and make decisions based on data rather than hunches—a principle fundamental to our success at TrafficBroker. I didn't realise that turning uSwitch around using data-driven decisions would define the next decade of my career.
9 years later, that gamble, assisted by data, became the cornerstone of a £2.2 billion transaction—and revealed a pattern of data maturity I've since repeated across multiple businesses, regardless of their starting point.
The £5 Million Question: What Had We Actually Bought?
A few months after we returned from Vegas, Neil asked my friend Paul Ingles and me to examine what he'd bought. It was a spring day when we turned up at the offices in Victoria that they shared with the Telegraph newspaper.
This spectacular location, where they occupied 2 massive floors, was a nod to the previous glories, but its staggering decline meant the entire company was now huddled into a corner. We met some fantastic and passionate people, many fundamental to uSwitch's subsequent resurgence. But our starting point was the source code, and that was like uncovering a technical horror story—dependency injection so convoluted I immediately vowed never to look at it again.
But the true shocker was the data: no one at uSwitch could tell us how much money they were making, not with any precision, not for yesterday, last week, or even last month.
It contrasted to working at TrafficBroker, where we had optimised billions in marketing spending to the microdollar. This precision helped us buy uSwitch and accumulate enough Amex points to fund extravagant trips to Vegas. uSwitch, on the other hand, operated in what appeared to be a complete data blackout.
The 97% collapse in value suddenly made perfect sense.
A consulting firm's report Neil had provided concluded that "competition had caught up, supplier relationships had deteriorated, and the business was overstretched," but these were just symptoms. The root cause was painfully clear to Paul and me: uSwitch lacked the fundamental data capabilities to understand its performance, make evidence-based decisions, or optimise its operation.
The lack of data focus had the following business challenges:
No sales visibility - Exact figures on switches were unavailable or unreliable
Approximate profitability - Calculations were based on a manual estimation process
System fragility - Basic reports would take hours to run, if they ran at all, and could even take the site down
This was our starting point—and over the years, 3 distinct stages emerged in our transformation journey that any business can learn from.
Stage 1 (2009-2011): Finding Our Footing (and Missing Millions)
Our first priority wasn't implementing cutting-edge analytics or flashy machine learning algorithms but establishing essential control and confidence in our fundamental data.
The existing systems couldn't be instantly replaced—there was a business to run. Building a proper data foundation is time-consuming, so the existing data warehouse that powered the limited insight had to be maintained alongside building something new.
We left a mostly contracted team to manage this data as we moved to more appropriate data stores, implemented proper data governance and created reliable reporting systems.
I remember the frustrating contrast to TrafficBroker, where we invested in structured and segmented data so everyone could own a metric and measure their performance. It created a culture of ownership and responsibility. However, that experience ensured we understood that any technical achievement would be meaningless if we didn't address the data, too.
Objective: Understand the Past
Looking back, we focused on three core principles:
Control - Standardising processes for data capture, storage and access
Single source of truth - Establishing authoritative data sources for each part of the system
Statistical thinking - Ensuring we use basic statistical principles to interpret data generated
This foundation-building phase is unglamorous work, and the impact takes time. You have to trust the process, building sources of data and visibility. Each element released some value, but as we completed parts of the migration, the sum of all the work became substantial.
The Breakthrough: Finding Missing Millions
In an early conversation with the CEO, Steve Weller, he mentioned a cheque from one of the energy companies in his desk drawer. A token payment recognising unpaid invoices, for tens of thousands, that he never cashed in. He was convinced they owed us much more and frustratedly told us, "I know they're not paying what they should be, but we can't prove it."
As we reworked the systems, capturing and improving data collection on the website and implementing proper tracking of conversion data, we also started looking at the quality of data we received from energy suppliers.
Along the way, I never forgot that conversation with Steve. So a few years later, when we could finally undertake the painstaking reconciliation of every switch recorded in our system against what suppliers had reported, I was really interested to see what we would find.
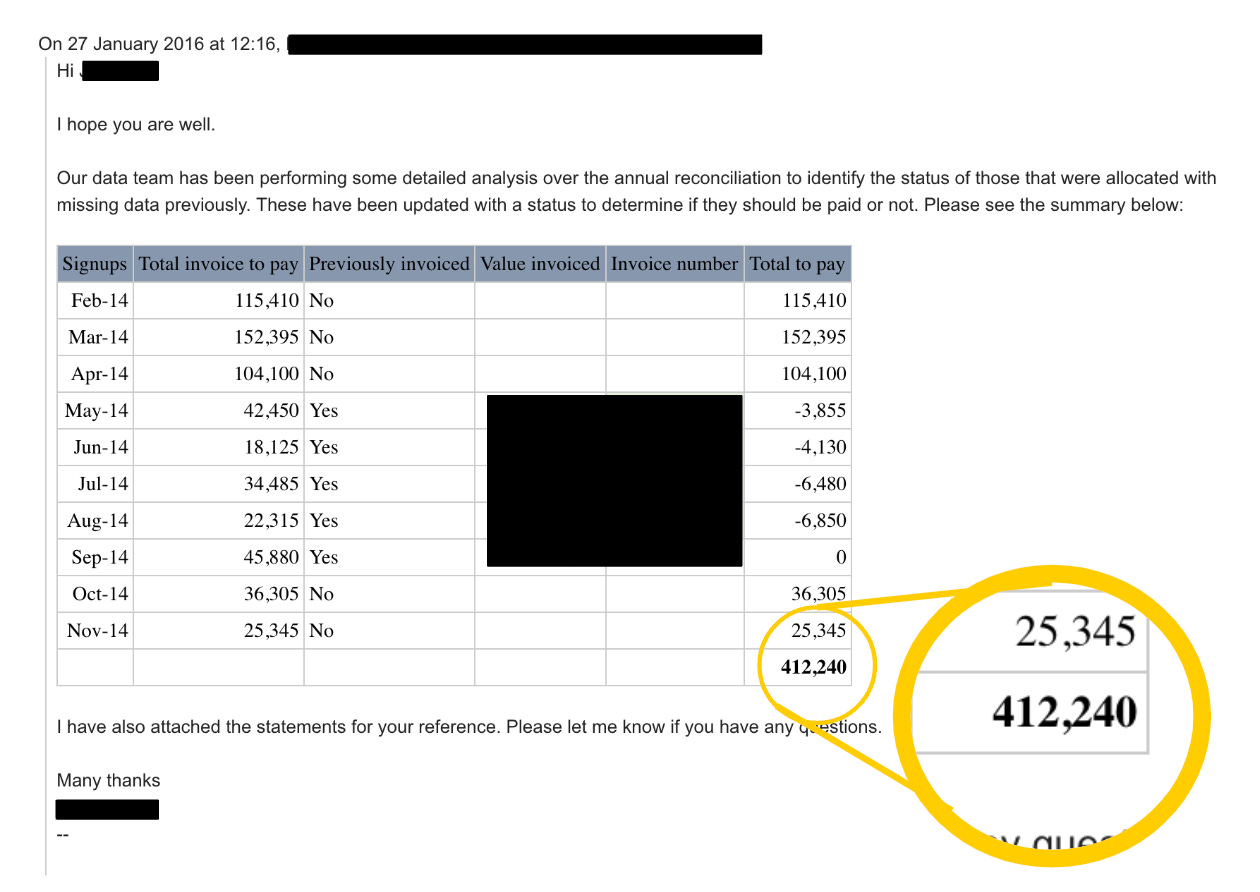
I still remember the look of satisfaction on Steve's face when we showed him the missing millions from our supplier reconciliation. It proved he was right to hold out, as nearly every supplier owed us over £100k. But the biggest offenders (including those who sent the cheque) approached half a million pounds each.
This wasn't just a one-time windfall. By implementing systems to monitor these discrepancies in the future, we:
Improved the margin per switch
Enhanced the accuracy of our financial reporting
Managed credit risk more effectively across suppliers
But perhaps most importantly, we created confidence in our data, which enabled the next stage of our journey—moving from just understanding what happened to seeing and reacting to what was happening right now.
Key takeaway: Before building anything innovative, you need absolute clarity on your baseline metrics. Establishing reliable data foundations creates the confidence necessary for everything that follows - you can't improve what you can't measure.
Stage 2 (2011-2013): From "What Happened?" to "What's Happening Now?"
With reliable base data in place, our focus shifted from understanding the past to creating real-time visibility of current performance. This wasn't a case of making reporting faster; it was a shift in how the business could operate, react and ultimately compete using data.
Objective: React to the Present in Real-Time
Achieving this required rethinking how data served different parts of the business:
Information creation - Not just providing raw data but creating insights for specific contexts
Multiple views of the truth - we realised that specialist teams need to view the source of truth we had created in different ways
Meta-products - Investing in creating our own tools to manage and present data appropriately
A simple example illustrating this shift is visualising geographical data: Consider the difference between the London Tube map and an Ordnance Survey map. Both are built from the same source of truth, but each models it differently for different uses. The Tube map helps navigate the Underground at the cost of accurate distances, while the OS map shows actual distances but might not help you plan the most straightforward journey.
Similarly, we realised that different questions in our business required different data models, all built upon our reliable foundation.
The Breakthrough: Dominating Paid Search Through Superior Data
This flexibility in our data approach gave us a compelling competitive advantage in our most important customer acquisition channel: paid search.
Google's advertising platform operates on a modified second-price auction. For keywords like "energy switching," the higher your bid, the more visibility you receive, and the more customers you acquire.
Back then, most comparison companies managed their paid search like other marketing channels—with fixed monthly budgets. When market conditions fluctuate, they often exhaust their budgets before month-end and disappear from the auctions.
Our approach is powered by our data.
We could attribute our revenue to our marketing spend in real-time by connecting transaction data to supplier commercials and historical trends. It allowed us to build an ROI-based bidding system that:
Calculated the precise value of each keyword and customer segment
Adjusted bids automatically based on changing market conditions
Allowed us to manage our budget based on return, not arbitrary limits
Understanding the auction dynamics with this connected data approach, we learned to "burn" the competition. Instead of maximising our own efficiency, we would strategically sit beneath competitors in auctions, bidding high enough to drive up their costs while staying profitable ourselves. This steadily ate away at their budgets until they would disappear from the auctions entirely.
Adam Kirby, our Head of Marketing, who spearheaded this approach, would be delighted as competitors dropped out of the auctions toward month-end. We'd often find ourselves alone in the auctions, scooping up switches at bargain prices while our competitors sat on the sidelines with depleted budgets.
This approach allowed us to capture more market share at a lower overall cost, dramatically improving our profitability. More importantly, it demonstrated the power of connecting different data sources to create real-time actionable information.
Throughout the organisation, teams began building specialised tools and views of our data, each optimised for their specific needs. We created automated P&Ls for our finance teams, experimented with attribution models for our marketing team, and built supplier performance dashboards for our commercial teams.
The organisation became more data-driven, more autonomous, and notably more effective. But the most transformational was still to come—when we stopped "navel gazing" and turned our focus outside our business.
Key takeaway: Once your data foundation is solid, create flexible views tailored to different teams' needs. This shift represents a move to real-time information that helps you understand what's happening, react faster, and outmanoeuvre the competition.
Stage 3 (2013-2018): Influencing Others with Data
In this final and most impactful stage of our data maturity journey, we shifted from looking inward to looking outward. Using our data to influence customers, suppliers, and even regulators in ways that benefit our company. Our data became a strategic asset that created possibilities beyond just internal optimisation.
Objective: Shape the Future with Your Data
This evolution built upon our previous capabilities but required a fundamentally different approach:
External sharing - Using our data to influence customers, suppliers, regulators, and partners
Experimentation and research - Investing in more specialisation within the teams creates new levels of insight
Market insight development - Positioning ourselves as the authoritative source of market intelligence
This approach helped sustain the business model, opened new possibilities for growth through innovation and, most importantly, gave us a real competitive advantage.
The Breakthrough: From Supplier's Vendor to Strategic Partner
At this point, uSwitch represented approximately 50% of the online energy switching market. This volume allowed us to command market-leading rates for each energy switch, creating tension in our supplier relationships. We received feedback that our commercial terms were too high and that volume alone no longer justified the premium.
As part of one sales process, the buy-side advisors conducted extensive interviews with each of our suppliers. The unanimous feedback: our volumes allowed us to command market-leading rates, but they are unsustainable as we provided no long-term strategic value.
We knew we needed to evolve our relationship with suppliers from purely transactional to strategic partnership. Our bet was that our unique view of the energy market provided the perfect opportunity to create this.
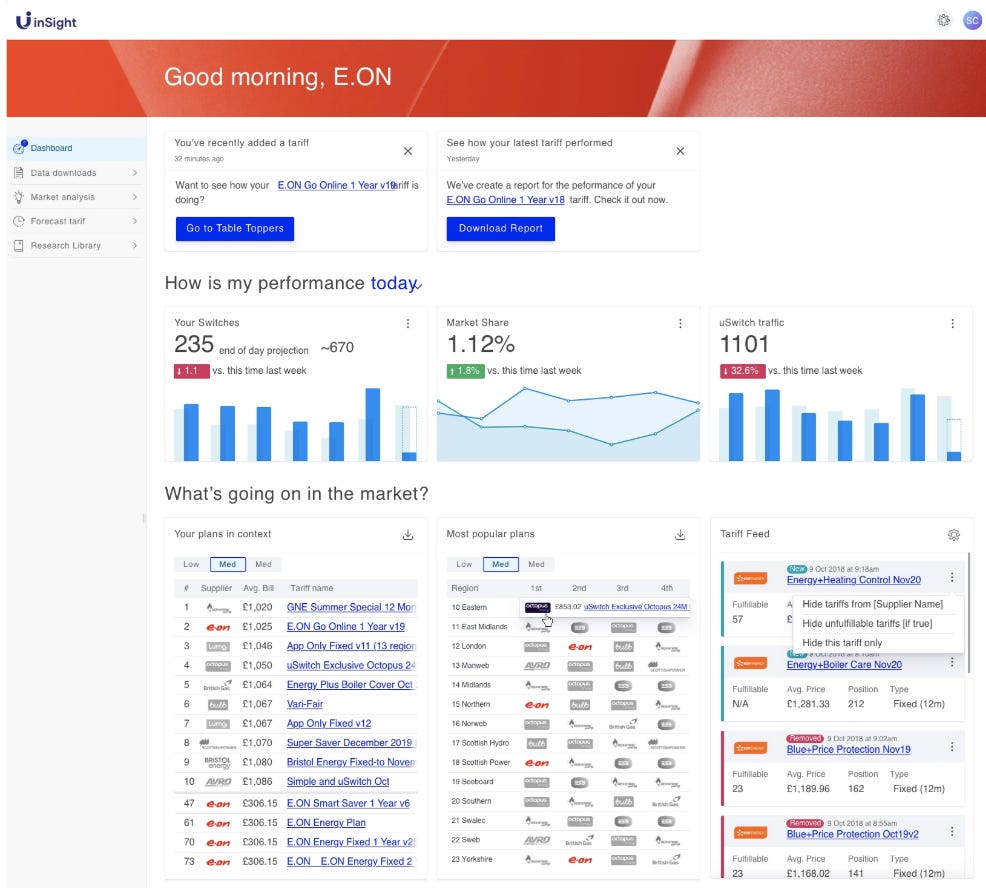
We developed "inSights," a data product for energy suppliers that consisted of:
Access to raw market data that could feed into their models
Tools and dashboards that allowed them to access market insights efficiently
Consultancy services where our data scientists conducted bespoke research
The value became obvious when British Gas, the first supplier to sign up, used our market information to more accurately predict churn and adjust their energy hedging strategy. They recouped our fee almost immediately through improved forecasting.
As the product evolved, we signed up most of the big energy suppliers and started to help the plethora of new start-ups. The strategic impact was profound:
CEOs became regular users and saw our branded insights
Teams previously required to accumulate partial marketed insight were no longer needed with access to our tools
We hired the first power user from British Gas, who joined our team to advance its capabilities
Suppliers became dependent on our data for their planning and pricing
This strategic partnership transformed our position in the market. We were no longer just a sales channel but embedded in their businesses. And this gave us unprecedented influence.
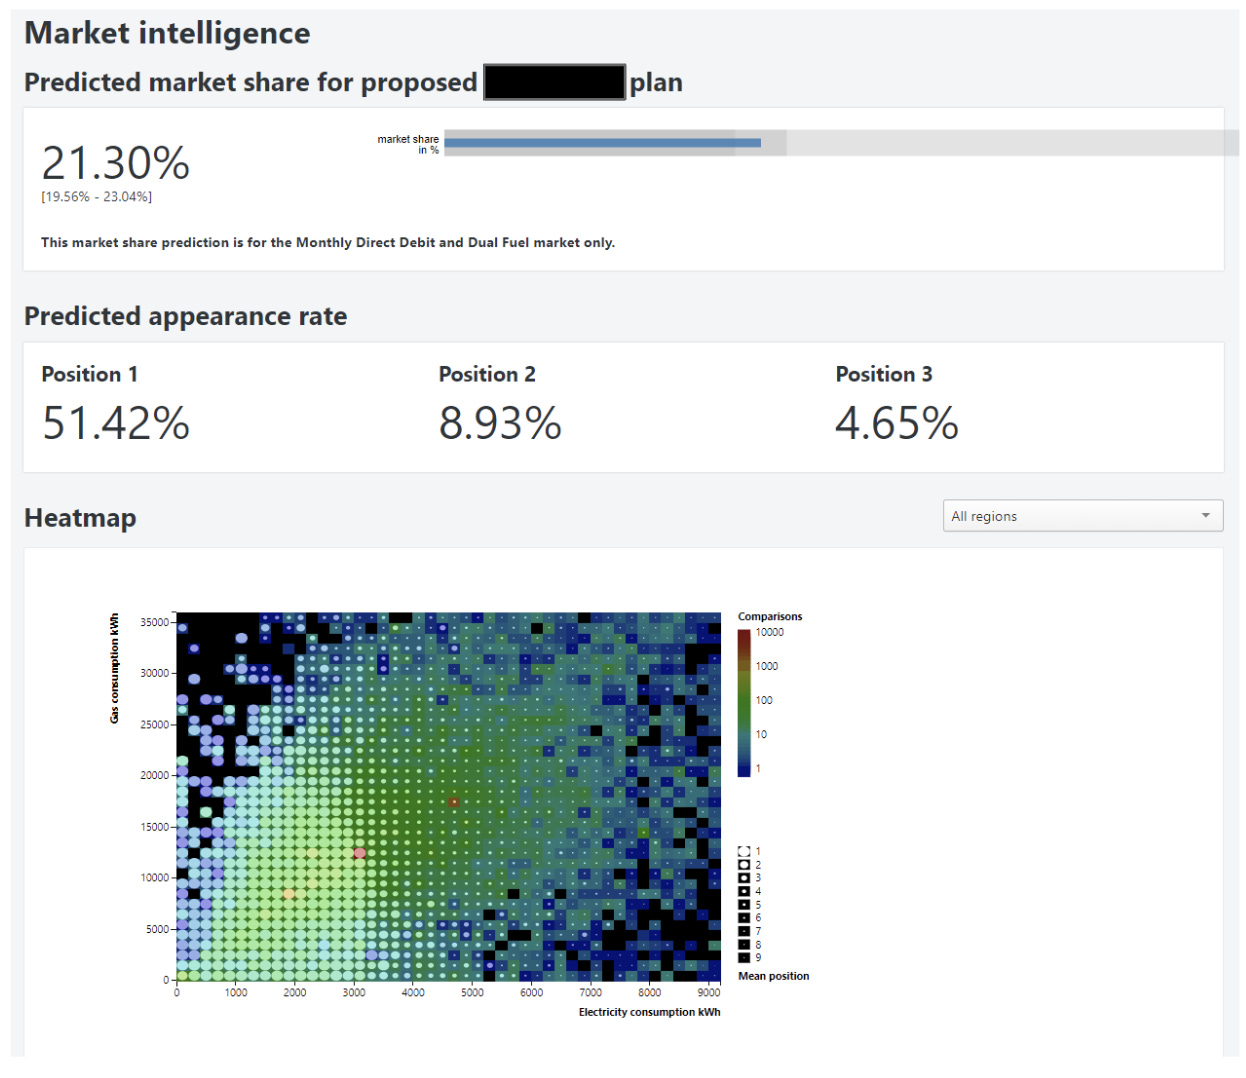
For example, suppliers began using our data to target specific customer segments in different regions with tailored pricing strategies—something impossible before. This more sophisticated approach to the market improved our platform's conversion rates while helping suppliers achieve their acquisition and margin goals.
All this while generating more than 7 figures in direct revenue from the inSights product.
Beyond Suppliers: Influencing Regulation Through Superior Data
Our data maturity also positioned us to influence regulatory decisions that benefited the market and our business.
When energy regulator Ofgem was tasked with setting a price cap, they initially planned to base the level on consumer research. This approach would provide little insight into actual market dynamics.
Emma Bush, the GM of our Energy vertical, took it upon herself to address this.
Her idea was to draw on our detailed understanding of the correlation between savings and conversion rates that we used daily to understand and optimise our business to ensure the market remained liquid. We provided Ofgem with extensive data and models that simulated the impact of different cap levels on switching activity. Showing them how to implement policy whilst retaining an active energy market.
I'll never forget when Emma returned from Ofgem's offices after walking them through our models. It was the moment I fully grasped how far we had come as a business. We weren't just reacting to the market anymore but helping shape it. The same data approach we used to fix our operations began influencing national policy.
Emma had taken what was possible with data even further than I had imagined.
This work:
Influenced their decision-making through objective, data-driven evidence
Established a strong relationship with the regulator
Enabled us to predict the impact of regulatory changes and plan ahead of time
By this point, data wasn't just helping us understand our business or optimise our operations—it was actively shaping our future and the future of our market.
Key takeaway: At the highest level of data maturity, you can leverage your insights to influence external stakeholders and shape market conditions in your favour. When your data becomes a trusted industry source, you gain influence beyond operational efficiency.
From a £5m Gamble to £2.2 Billion Exit: The Three Stages of Data Maturity
Looking back on that decade-long journey, I feel privileged to have been part of it. Working alongside some incredible people to transform uSwitch often felt like chaos, but in retrospect, a clear pattern emerged—one I've since seen repeated across different businesses.
What strikes me most about this framework is that success doesn't hinge on technology—it's about building capabilities in the correct sequence and applying principles consistently without trying to skip ahead.
The foundation stage gives you control of what actually happened, not what you think happened. With that confidence established, the flexibility stage connects teams with views of the same reliable data to react in real time. Finally, the influence stage—which few companies ever reach—lets you shape external decisions from suppliers to regulators.
The parallels to that night in Vegas, where this journey began, are impossible to miss. In blackjack, amateurs rely on hunches and may enjoy short-term wins, but probability eventually catches up. Professionals understand the system, calculate odds methodically, and make decisions based on data patterns rather than feelings.
Business works the same way. Amateurs make gut decisions that sometimes pay off, creating the illusion of skill. Professionals build systems that understand the past, clarify the present, and ultimately shape the future.
That £5 million gamble in Vegas eventually led to a £2.2 billion transaction—an extraordinary value creation story. But like a winning blackjack strategy, the principles behind this journey aren't magical or mysterious—they're systematic and replicable.
A note of thanks: This transformation was a massive team effort with far more stories than I could share. I've missed acknowledging so many brilliant people who contributed, but special mention to Tom Lyon for teaching us negotiation, Ewan for his Shuffle, Matt Whitaker's labour of love, Paul Lamb and Rachel, who built the first inSights PDF, Tickle Tiger for help at E.ON, and Carl Gaywood and Neil Hutchinson for their guidance and support. These represent just a fraction of the talent behind this journey.


Incredible story! Thanks for sharing and for reminding me of our Vegas trips :)
I love this insight: "What strikes me most about this framework is that success doesn't hinge on technology—it's about building capabilities in the correct sequence and applying principles consistently without trying to skip ahead." - I find that organisations often want to skip ahead to the sizzly stuff before finishing the "boring data stuff" i.e. the steak.